


OVERVIEW
See where money leaks and what’s recovered
When you sell into big retailers, money quietly leaks into shortages and chargeback claims, often 3 to 10% of margins each year.
PRA gives teams one place to see the full recovery story, so they can answer:
“Where did the money go? and are we getting it back?”
It replaces 3 to 4 systems and scattered exports with a clear, review ready story, so even people who do not live in the data every day can see what was invoiced, what was deducted, and what was recovered.
Time saved each year
1000+ hrs
Systems to check
3-4
1 System
Additional annual profit
$15M+
Accounts on PRA
80 Accounts
Next
What teams were struggling with before PRA

CONTEXT
Before PRA, recovery was technically happening but the experience was messy
Teams stitched together one recovery story from scattered tools and files just to answer two basic questions: “Where did the money go?” and are we getting it back?”
What wasn't working
01
No single, trusted view
Potential, in progress, and recovered dollars lived in different places, so even the basic numbers did not match across teams.
Systems to check
3-4 systems
02
Data scattered across tools
Shortages and chargebacks sat in separate tools, spreadsheets, and 10k row exports. Teams often worked with incomplete or outdated data.
Spread sheets to reconcile
10+ sheets
03
Reviews turned into data clean-up
Before every review, teams spent 2 to 3 hours fixing data just to see if money was being left on the table. Leaders could not see leakage or recovery at a glance.
Time spent for data clean-up
2-3 hrs
"Most reviews started with fixing data, not making decisions, and leaders still couldn’t see at a glance if money was being left on the table."
What each team wanted from PRA
“I want one place to see potential, in progress, and recovered dollars across shortages and chargebacks, so I can walk into reviews prepared instead of fixing spreadsheets.”
-
Deduction & finance analysts
“I want a clear, trusted view of where money leaked and how much we have recovered, so I can make better decisions in reviews.”
-
VPs & directors
“I want consistent recovery metrics across accounts and dispute types, so I can show PRA's value and refine our playbooks.”
-
Account managers & Product ops teams
Next
How we defined “good” before designing anything

GOALS
What success needed to look like
Once we understood the messy reality, we defined what “good” should look like for the people using PRA, for the business, and for the system behind it.
What we were aiming for
TEAMS
Review ready teams
Review prep
2 to 3 hours fixing exports from 3 to 4 systems before each review.
Review ready
1 PRA view teams can open and start the review immediately, with the recovery story already clear.
BUSINESS
Clear recovery story
Story gap
Recovery performance was hard to explain and different teams walked in with different numbers.
One story
The same PRA numbers show where money leaked and how much was recovered across QBRs, renewal decks, and finance reviews.
SYSTEM
Unified recovery system
Scattered system
Shortages and chargebacks sat in different tools and spreadsheets with no shared way to connect invoiced, deducted, disputed, and recovered.
Unified system
One recovery system reused across dashboards, exports, and weekly email summaries, with the same definitions everywhere.
"We aligned around three layers of success, the people using PRA every week, the business, and the system powering it."
Next
How I approached the design

Approach
How I approached the design
The work began by understanding real recovery workflows inside CIQ and aligning definitions with CS, product, engineering, and brand-side teams to create a trusted recovery model.
How I designed this
Map real flows
Followed shortages and chargebacks from Vendor Central into CS and finance spreadsheets to see where data broke or diverged.
Align on one recovery definition
Worked with deduction analysts and CS to agree on a single set of recovery states and KPIs that would be treated as the source of truth.
Iterate using live pilot data
Designed dashboards and the Recovery Journey using data from pilot customers, and refined them based on what came up in weekly CS and review calls.
Roll out in phases
Shipped Shortages and Chargebacks dashboards first, then added the unified Profit Recovery Overview and weekly emailer once the model was stable and trusted.
Next
The system decisions behind PRA

SYSTEM
Inside the PRA system
PRA was released in phases to stabilize the data, align definitions, and make recovery easy to understand across shortages and chargebacks.
How we built it in phases
PHASE 01
PHASE 02
PHASE 03
PHASE 04

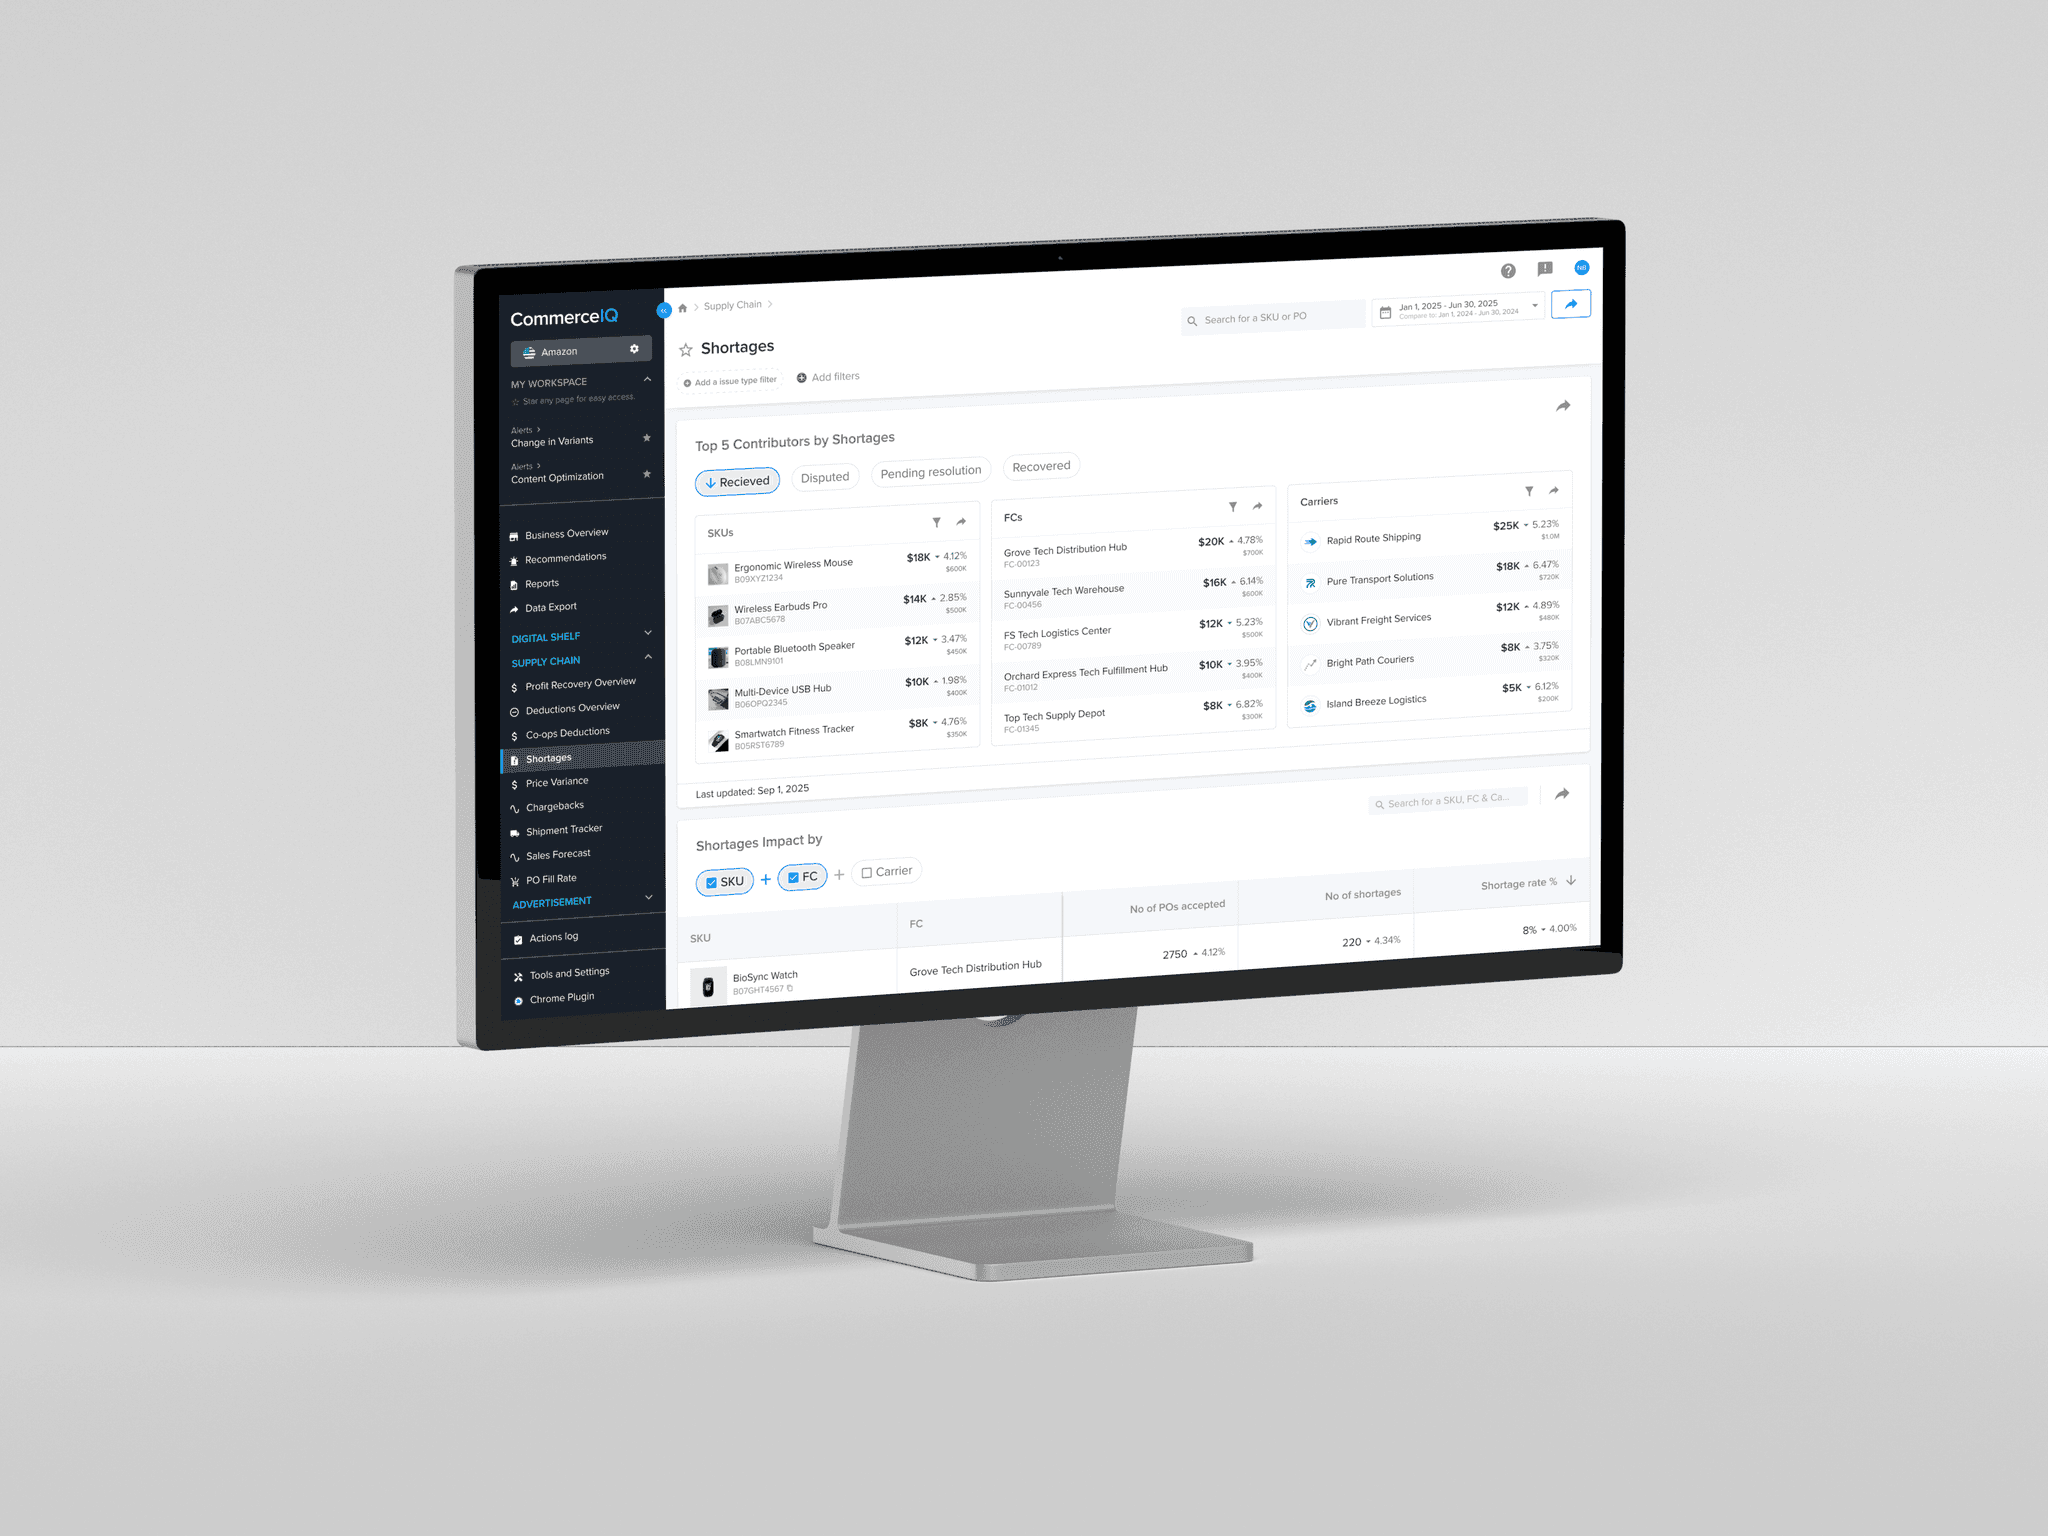
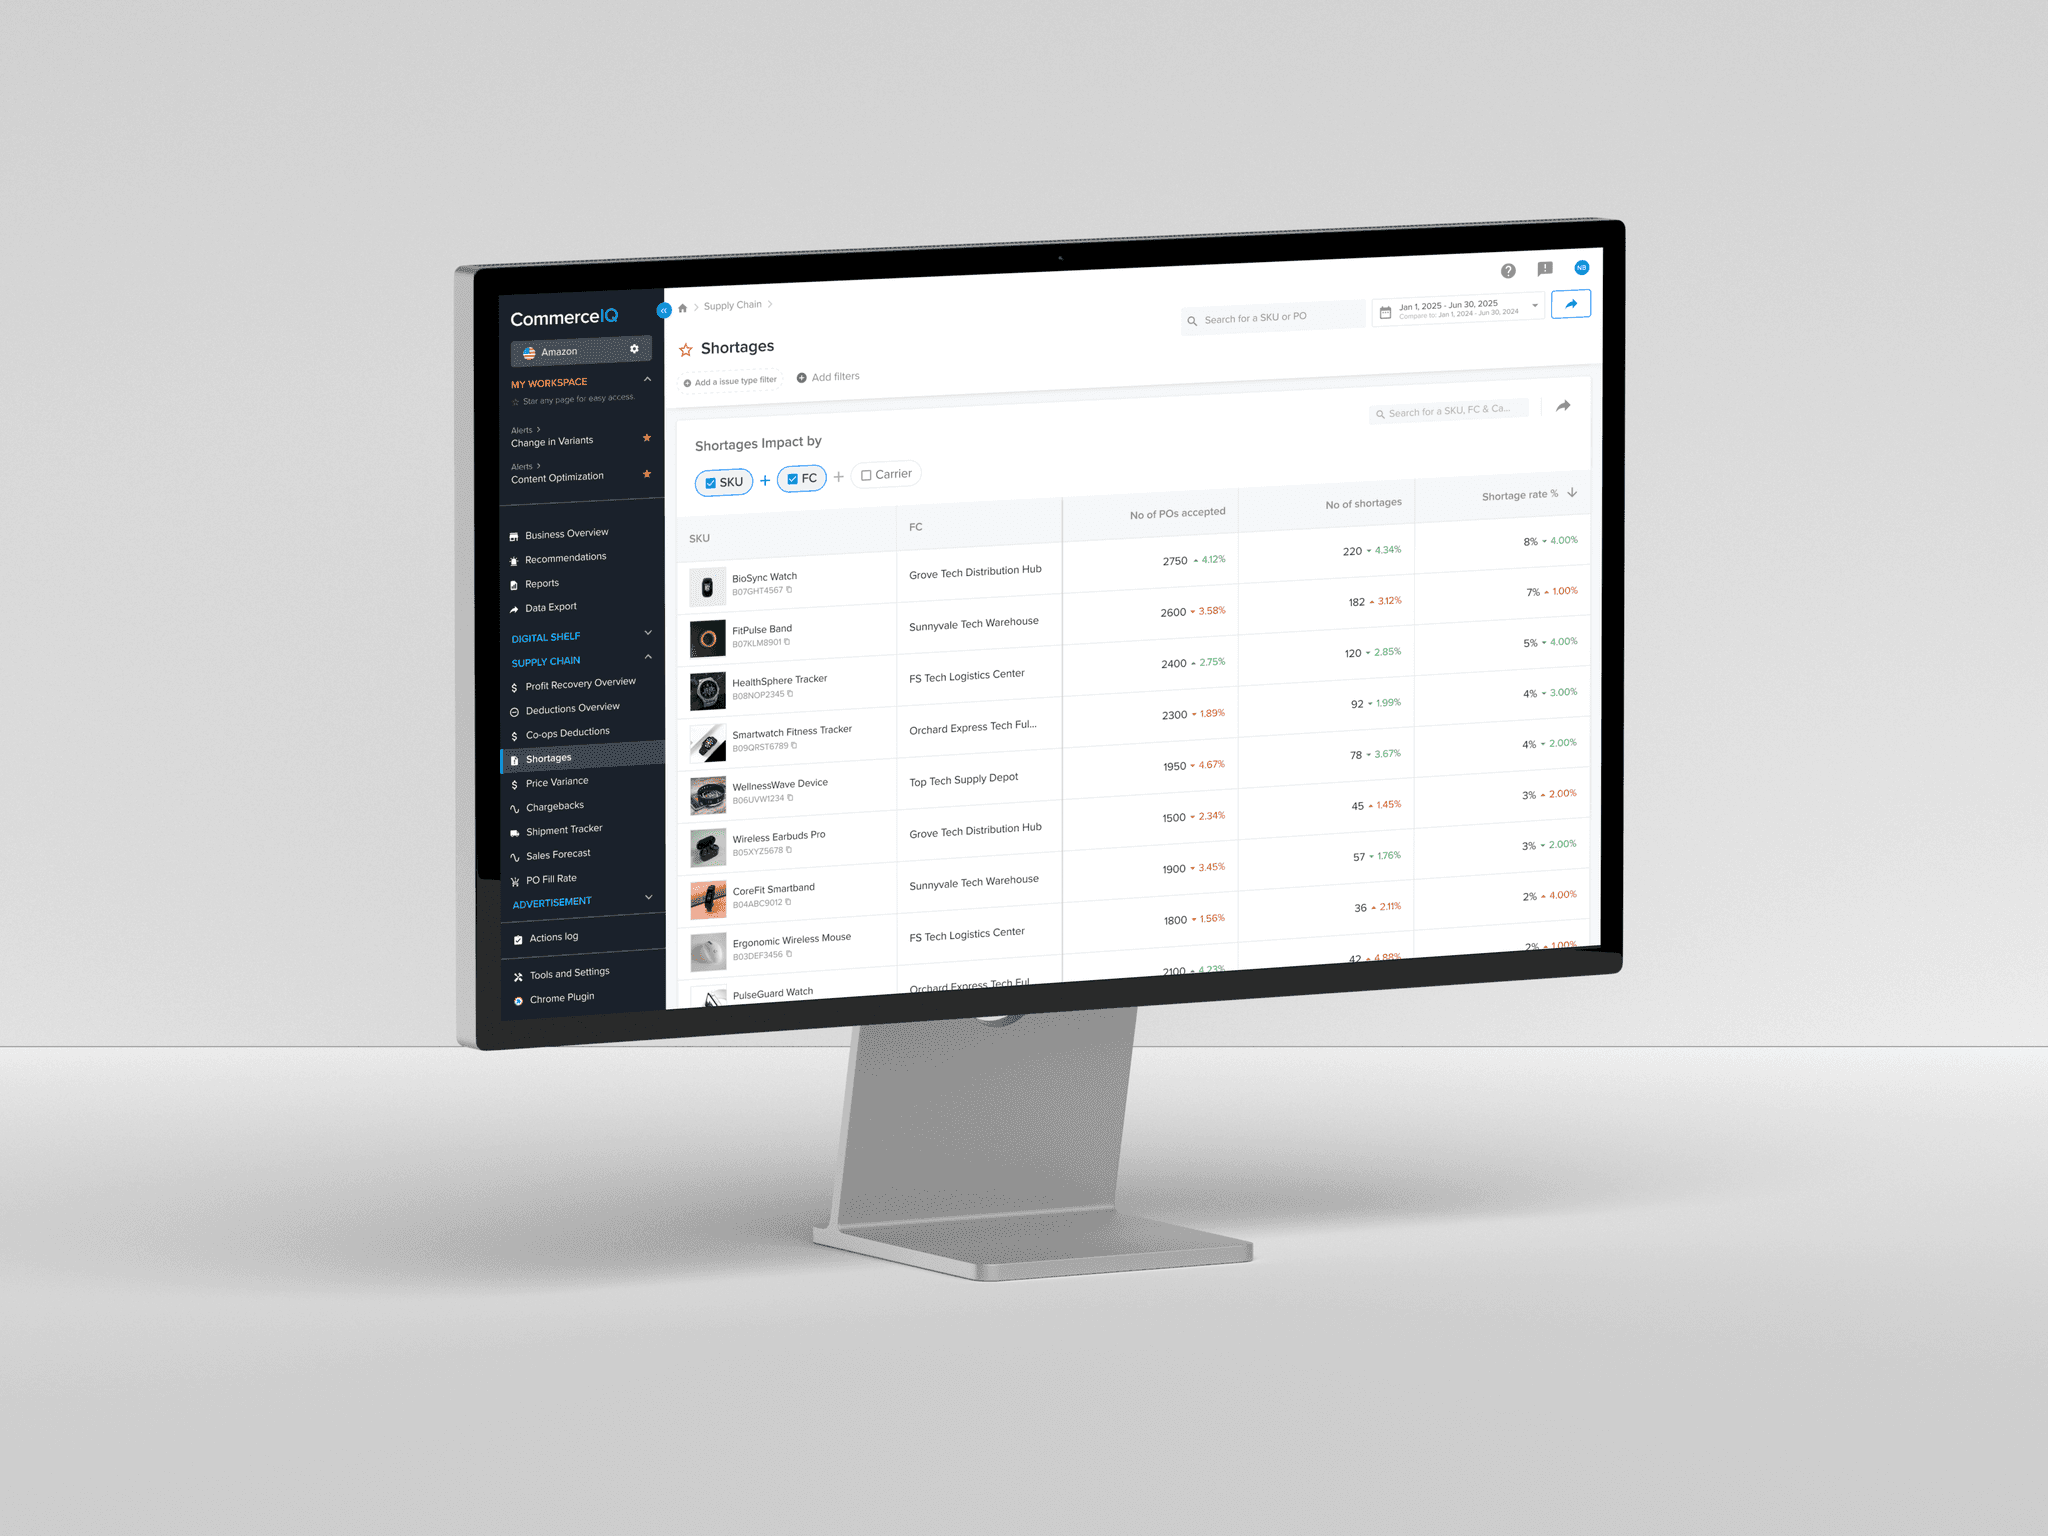


Surface shortages and chargebacks clearly
Shortages and chargebacks were brought into a single view to surface unrecovered and at-risk dollars, showing where problems existed and what was driving them.
What this unlocked
Clear visibility into at-risk recovery.
Faster identification of problem drivers.
A shared baseline before recovery actions.


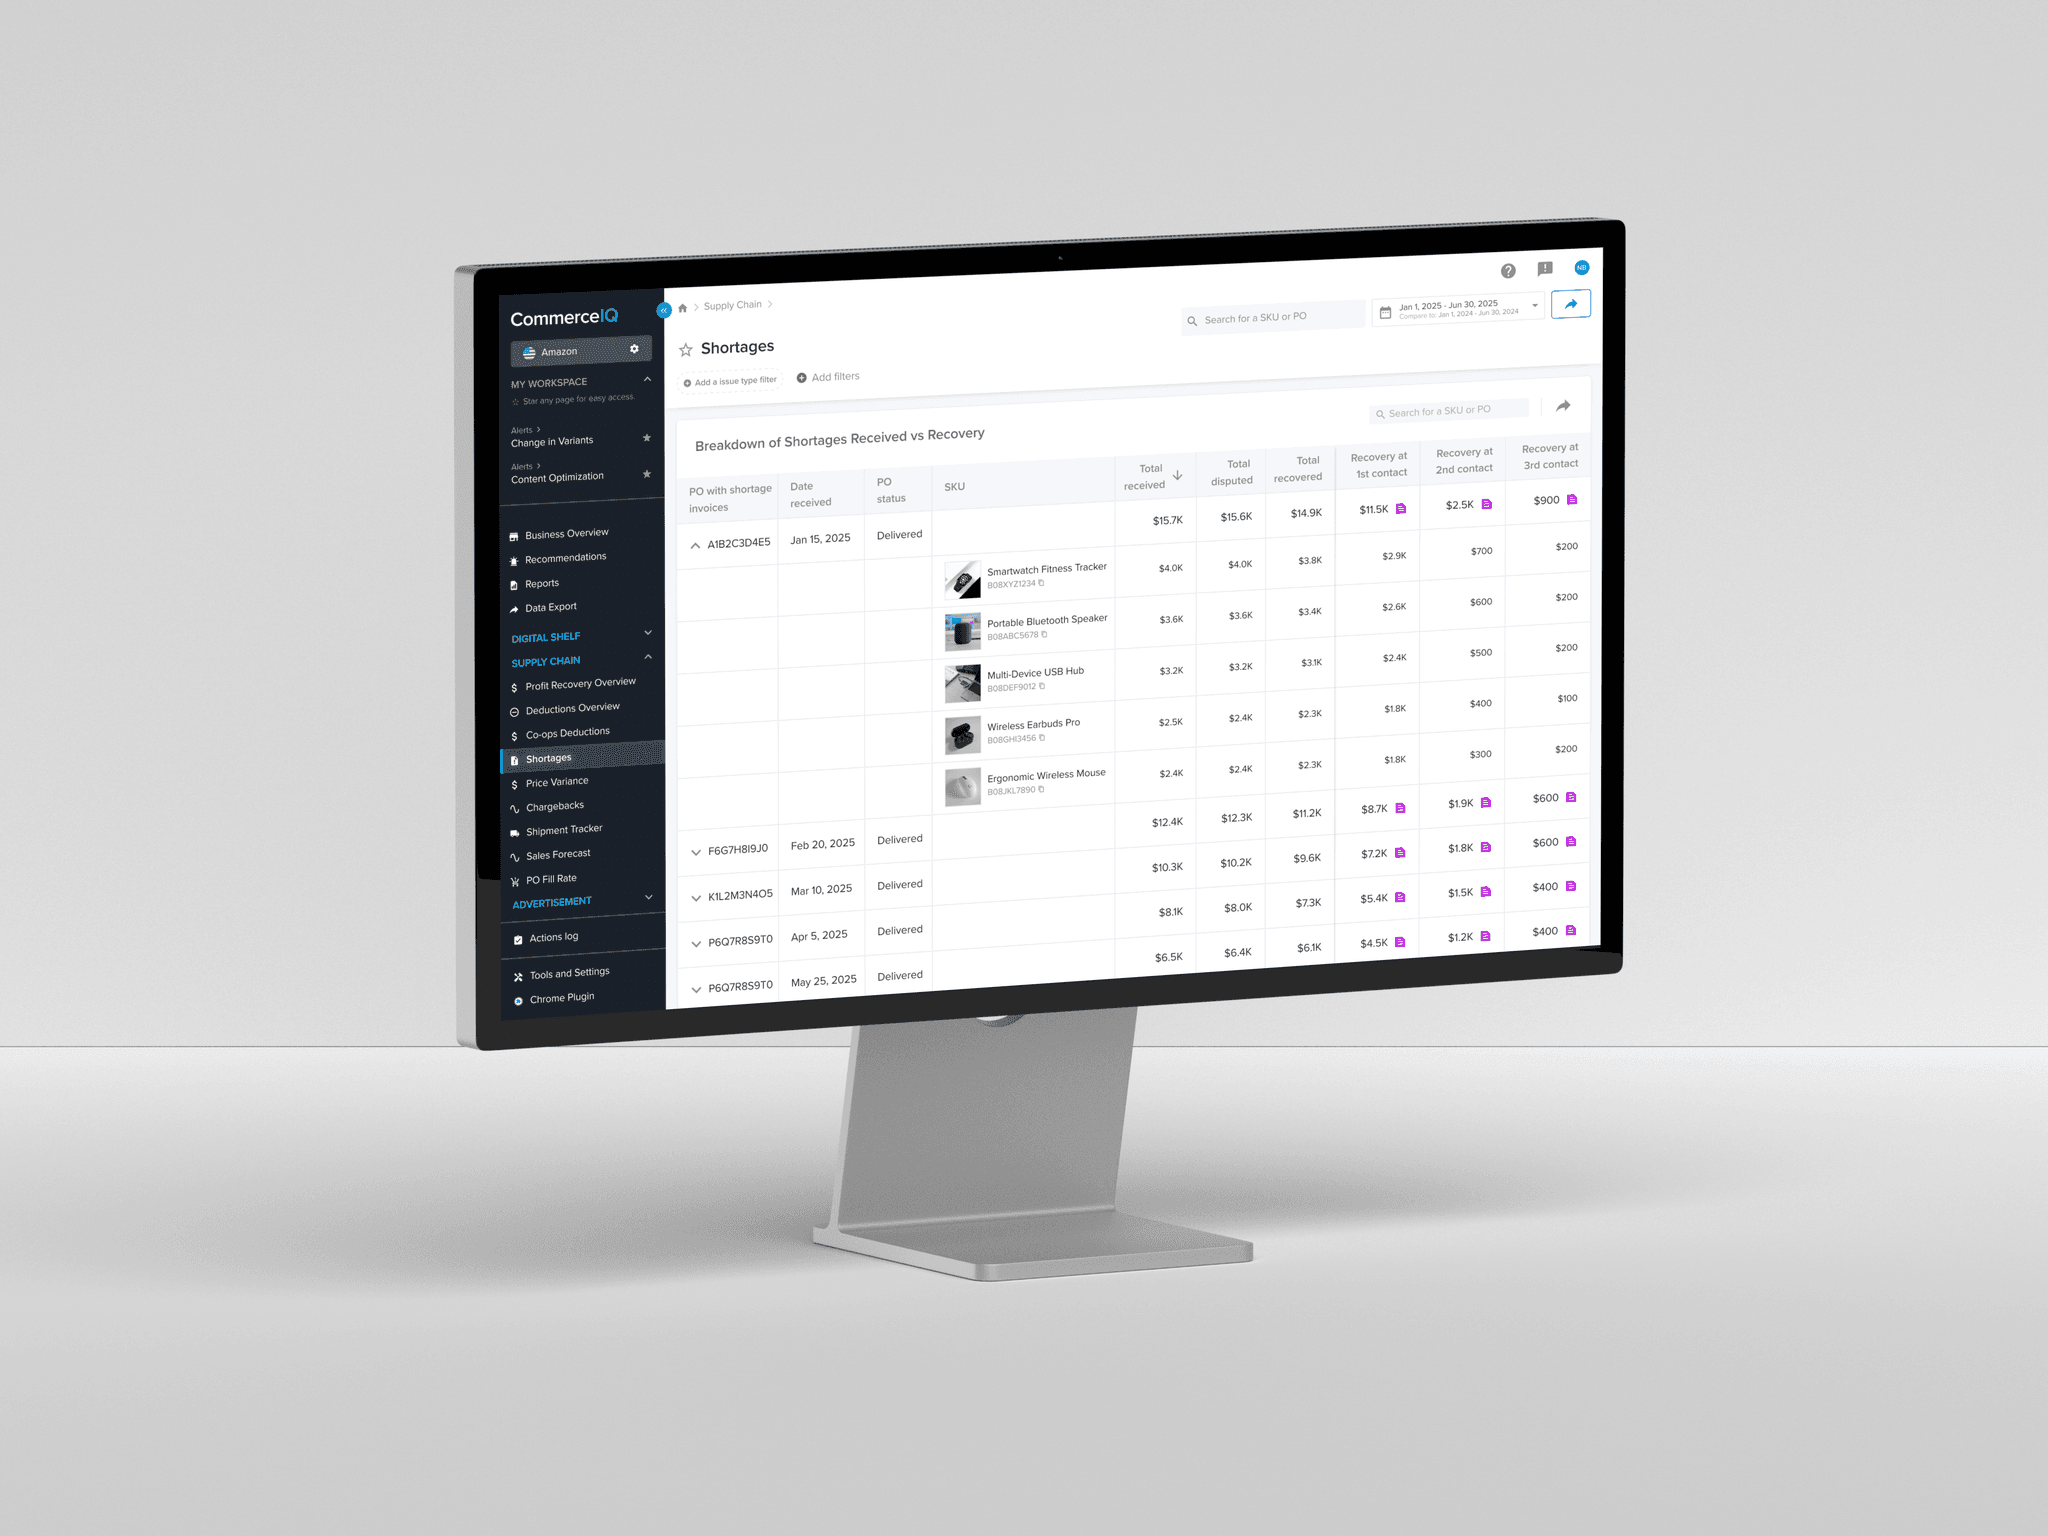
Define one recovery story
The Recovery Journey connected invoiced, disputed, pending, and recovered dollars into a single, readable flow, giving leaders a clear view of recovery end to end.
What this unlocked
A shared mental model for recovery across teams.
Consistent interpretation of recovery progress.
Review-ready storytelling anchored in real data.


Reduce friction with weekly summaries
A weekly PRA email summarised recovery progress and key changes, making it easy for leaders to get the full picture and jump into the product when deeper investigation was needed.
What this unlocked
Quick recovery summaries without logging in.
A clear path from email to in-product analysis.
Reduced friction in weekly review workflows.


Test a guided self-serve concept for PRA
This concept explored how prospects could estimate recovery and preview PRA value without going through a full sales cycle.
What this unlocked
Faster early-stage value understanding.
Lower friction in sales conversations
Next
My role and collaboration across teams

MY ROLE
What I owned, guided, and co-created
Owned the core PRA experiences end to end, aligned CS, PM, and engineering on a shared recovery model, and supported a junior designer to drive later iterations within the same system.
How I shaped PRA with the team
Experience name
Profit recovery overview
Shortages dashboard
Chargebacks dashboard
Chargebacks overview
Weekly emailer
Self-serve concept
Owned
Guided
Co-created
Next
Outcomes and what people said about PRA

OUTCOMES
What changed after we shipped PRA
PRA didn’t just add a dashboard, it changed how teams talk about recovery, prepare for reviews, and trust the numbers.
Why PRA mattered for teams & brands
Time saved each year
1000+ hrs
Most prep time (2–3 hrs per review) shifted from cleaning data to making decisions.
Systems to check
3-4
1 System
Teams no longer pieced together views from Vendor Central, spreadsheets, and internal trackers the full journey lived in one place.
Sheets to reconcile
10+
0 Sheets
Default PRA views removed the need to rebuild 10+ stitched sheets before each review cycle.
Additional profit recovered each year
$15M+
Much of this came from disputes that were previously missed or stalled because teams couldn’t track recovery phases consistently.
Accounts on PRA
80 Accounts
PRA became the standard recovery view across enterprise accounts, replacing custom sheets that varied from team to team.
“Once PRA went live, recovery stopped being a spreadsheet problem, it became a story we could stand behind in
every review.”
What people noticed
Next
See the PRA screens behind these outcomes

REFLECTION
Why PRA became a flagship project
PRA stood out because it addressed a real revenue problem and required design to work at the level of systems, not screens.
The challenge wasn’t adding dashboards, but creating a recovery story teams could trust and stand behind.
Real problem, real impact
This work addressed a real revenue problem.
Focused on recovery gaps that affected the business.
Design choices were driven by how recovery actually worked.
One mental model, many surfaces
Everything had to tell the same story.
Dashboards, emails, exports, and concepts stayed aligned.
Reusable patterns mattered more than perfect screens.
Trust as the real feature
Confidence mattered more than depth.
Teams needed to know nothing important was missing.
Everyone had to see the same picture.
THANK_YOU